Negative economic shocks can cause waves of investor pessimism about the resilience of banks, which in turn generate additional adverse macroeconomic effects. This column introduces the notion of pessimism in a real business cycle model. The possibility of waves of pessimism generates countercyclical demand from banks for liquid assets, such as bank reserves. Applying the model to the macroeconomic effects of the government supplying liquid assets, the authors find that a policy of accommodating banks’ demand is effective in stabilising the economy and present empirical evidence supporting this finding.
Lecturer in Economics London School Of Economics And Political Science
Banks’ funding inflows and outflows can be volatile. 1 They therefore keep a buffer of liquid assets, including bank reserves, on their balance sheets to ensure they can cope with high outflows without having to either borrow at an expensive interest rate (Bianchi and Bigio 2022) or sell illiquid assets (Drechsler et al. 2018). But can we think of episodes such as the global financial crisis as being the result of unluckily high funding outflows hitting banks?
In a recent paper (Porcellacchia and Sheedy 2024), we model the source of volatility in bank funding. To do so, we adopt the viewpoint of a literature started by Diamond and Dybvig (1983): banks are vulnerable to waves of pessimism that might trigger a bank run. 2 Pessimism about banks is self-fulfilling because it reduces their access to funding, forcing them to sell illiquid assets at a loss. This, in turn, confirms investors’ pessimistic expectations about banks’ financial performance. The possibility of self-fulfilling pessimism poses a coordination problem for investors in bank assets. But what is it that makes investors coordinate on pessimism?
Goldstein and Pauzner (2005) show that, under a minor deviation from perfect information, banks’ balance sheet fundamentals determine the likelihood of pessimism arising. 3 This is the approach we take to the coordination problem. 4 We find that pessimism is more likely to hit banks with small liquidity buffers because they are more fragile, so a small number of pessimistic investors is enough to force such a bank to sell illiquid assets and start the vicious cycle of self-fulfilling pessimism. To guard against this, banks increase their demand for liquid assets to reduce their fragility and stem waves of pessimism.
The mechanics of pessimism
Adverse economic shocks are a driver of waves of pessimism in the model. This is because banks’ net worth – the difference between the value of their assets and debt liabilities – plays a similar role to their liquidity buffers in determining fragility, and banks’ net worth is highly exposed to the performance of the economy. 5 In other words, banks with low net worth are more likely to be caught in a wave of pessimism, and in bad times banks make losses that reduce their net worth. This is in line with a common narrative about the events that unfolded during the global financial crisis: banks began finding it hard to obtain funding after an unexpected collapse in house prices that reduced their net worth.
An increase in the likelihood of pessimism raises banks’ funding costs and hence amplifies the macroeconomic effects of shocks to the economy. Investment in the economy is crucially dependent on bank credit. If banks are starved of funds as a result of pessimism, they supply less credit and so investment takes a hit. Quantitatively, pessimism increases the effect on economic output of a shock to the value of bank assets by about one-third on impact. Pessimism also makes the effects of shocks last longer. This propagation of shocks through time is due to the negative impact of more expensive funding on banks’ return on equity. With a low return on equity, it takes a long time for banks to build their net worth back up.
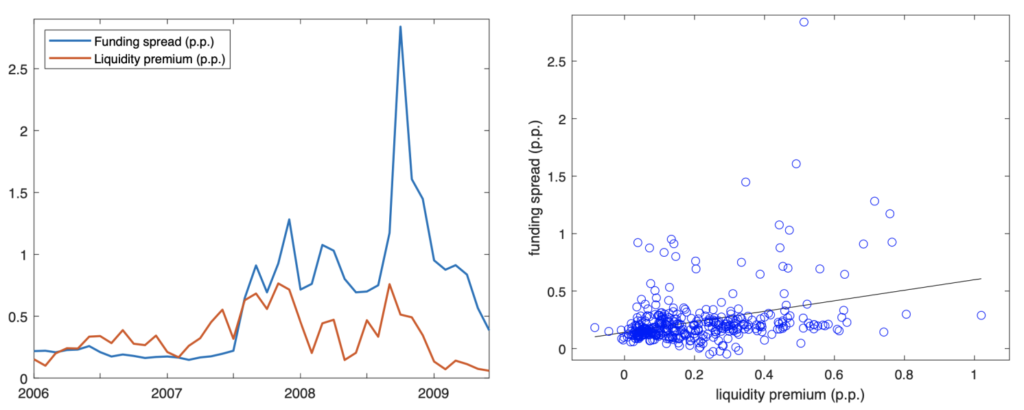
In the model, banks respond to adverse economic shocks by increasing their demand for liquid assets in an attempt to reduce their fragility and thereby stem pessimism. Unless the supply of liquid assets is perfectly elastic, this behaviour means that the prices of liquid assets increase in bad times. Evidence for this behaviour is provided in the left panel of Figure 1, which plots interest rate spreads during the global financial crisis. In this period both the funding spread, which measures funding costs for banks, and the liquidity premium, which measures the cost of holding liquid assets, were very high. 6 The right panel shows that expensive bank funding is generally associated with expensive liquidity, suggesting that this mechanism operates broadly, not just in financial crises.
Figure 1 Correlation of the liquidity premium and banks’ funding spread


Notes: The funding spread is the three-month (3M) LIBOR minus the 3M general collateral (GC) repo rate. The liquidity premium is the 3M GC repo rate minus the 3M US Treasury Bill rate. The chart uses US data expressed in percentage points (p.p.). The upper panel shows the funding spread and liquidity premium at monthly frequency around the global financial crisis. The lower panel is a binned scatterplot (with 300 quantile-based bins) of daily data from May 1991 to June 2023.
Liquidity policy
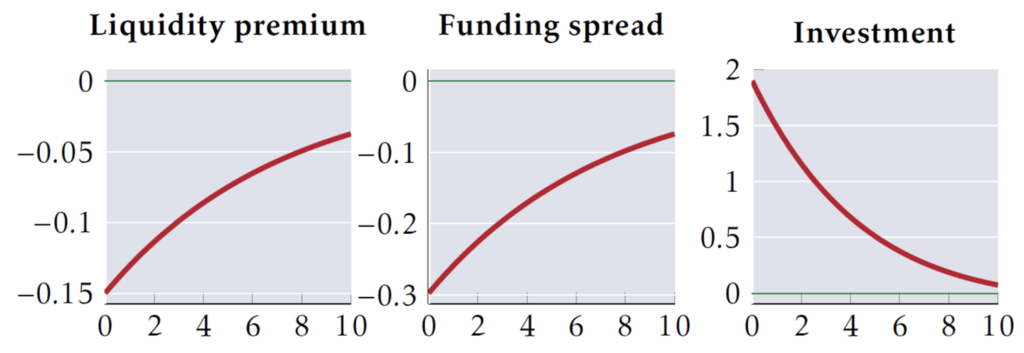
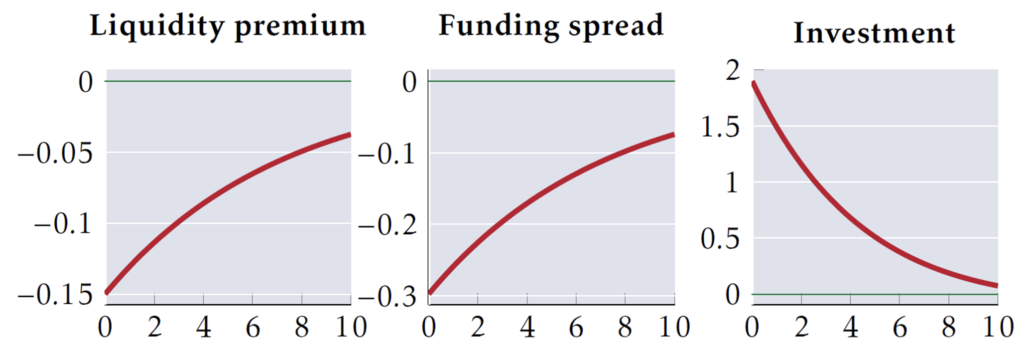
The role of policy in the model is to supply liquid assets, such as bank reserves. 7 So we can use our framework to analyse the macroeconomic effects of liquidity policy. We find that an expansion in the supply of liquid assets is beneficial in the short run because it boosts banks’ liquidity buffers. 8 This makes pessimism less likely and thereby reduces the cost of funding for banks. Lower funding costs are passed through in the form of lower bank lending rates, thus increasing investment and GDP. Figure 2 shows the effects of a persistent increase in the supply of liquid assets that reduces the liquidity premium by 15 basis points on impact and is slowly unwound over time. On impact, the funding spread is reduced by 30 basis points, leading to an increase in investment of about 2%.
Figure 2 Effects of a liquidity supply shock


Notes: The impulse responses are expressed in percentage points for the liquidity premium and funding spread and in percentages for investment. The x-axis is the number of years after the shock.
We provide empirical evidence for the effectiveness of liquidity policy by studying the causal effect of the liquidity premium on banks’ funding spread. The positive correlation between the liquidity premium and the funding spread in the right panel of Figure 1 is not evidence of causality because the liquidity premium is not an independent random variable. To deal with this endogeneity problem, we use data on US Treasuries, a key liquid asset. Crucially, US Treasuries are issued after their auction with a lag of a few days. 9 Hence, their outstanding quantity is predetermined at daily frequency and cannot possibly react either to the funding spread or to other drivers of the funding spread. 10 With this in mind, we use the stock of outstanding US Treasuries as an instrument for the liquidity premium, essentially narrowing our focus to daily variation in the liquidity premium induced by changes in the outstanding stock of US Treasuries. And we find a significant positive effect, suggesting that the liquidity premium is indeed a causal driver of banks’ funding costs.
The model implies that it is beneficial to supply public liquidity, such as bank reserves, elastically. When an adverse shock hits the economy, banks come under stress. Their demand for liquid assets increases, thereby pushing up the liquidity premium. By supplying extra bank reserves in response to this, the central bank can contribute to the stabilisation of the economy.
Conclusion
An important literature in finance formalises the idea that banks are exposed to the risk of bank runs. We take the methods described in the literature and adapt them so that bank runs can be integrated into a standard model used to study business cycles. This allows us to study the role of run risk in amplifying and propagating the business cycle and the role of policy in dampening it.
In this column, we focus on liquidity policy, but there are more dimensions of policy that we can study with our framework. The discount window, through which the central bank acts as the lender of last resort, and deposit insurance are important policies for financial stability and we analyse the effects of these in the paper.
Source: cepr.org


